103 – Apache NiFi Flowfile Provenance
This is the 3rd course in our beginner series – Start with 101 here
Additionally, you can follow along using our Auto-Launching NiFi – Learn how here
Thanks to the data provenance provided by Apache NiFi’s debugging capabilities, you are able to track your Flowfiles within your workflow from start to end. A Flowfile can have its content downloaded, inspected and replayed. The features that NiFi has means that checking provenance in NiFi is easier when you are troubleshooting, such as if you are trying to figure out why a specific path was taken within a workflow. You are able to make changes to your workflow without stopping it, and this ties in nicely with your ability to make minor changes and ensure a new path is correctly taken.
Right-click on connections or processors to gain access to data provenance. You may also look up data provenance from the “Provenance repository” in the “Provenance” menu. You will recognize a lot of what you see on the “NiFi Data Provenance” screen. Click the small blue icon on the right of each entry, (It is a small letter “i” surrounded by a blue ball), and you can see the details of each Flowfile.
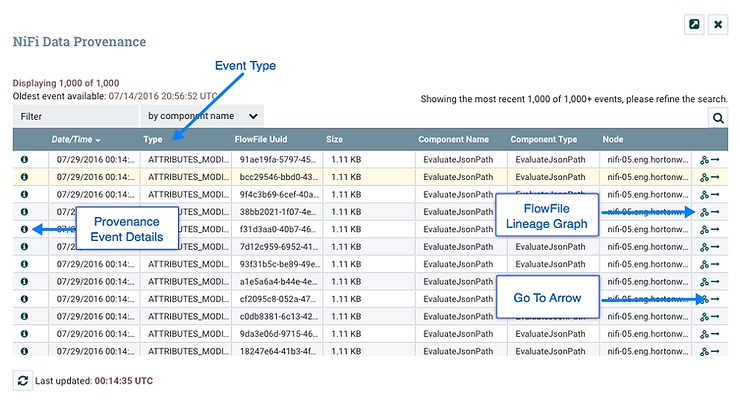
Source: https://nifi.apache.org/docs/nifi-docs/
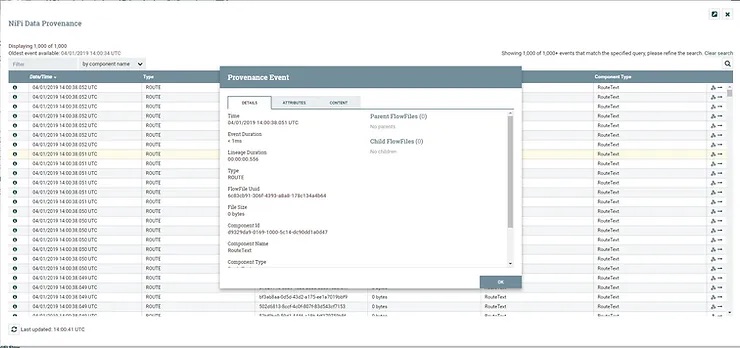
Flowfile Details
Click the Flowfiles details icon, and you will see an analysis of the content and the content’s metadata attributes. You may also see the Durations and Queue Positions.
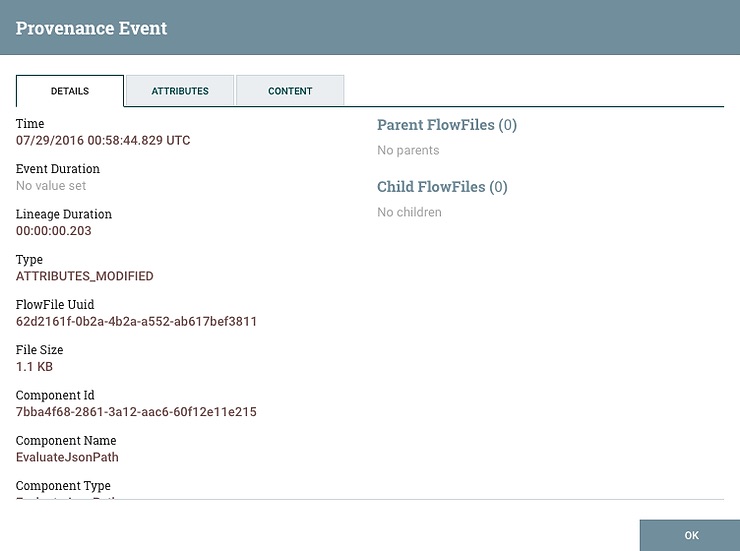
Source: https://nifi.apache.org/docs/nifi-docs/
You may investigate the before and after versions of your flowfile after processing has completed, and you may do this via the contents tab. You may read the information at your leisure, or you may download it.
If you wish to correct a problem, you may use the Fileflow Replay functions to make the connection to the flow and then replay your Flowfile again, at which point you check to see if it runs the correct way.
You can follow along using our Auto-Launching NiFi – Learn how here
Viewing Flowfile Lineage
You may find it easier to see a graphical representation of the path (lineage) that your Flowfile took within your dataflow. The icon to show lineage is on the right, and it looks like three empty circles that are joined by two lines. It looks a little similar to the drawing of a water molecule.
A DAG (Directed Acyclic Graph) is used to visualize lineage. It shows where routing or modifications took place in regards to the selected Flowfile. If you right-click a step in the lineage, you may view the Flowfile’s details at that specific step, or you may expand the flow so that you can see where the Flowfile was (possibly) cloned from.

Source: https://nifi.apache.org/docs/nifi-docs/
On the bottom left of the panel (the GUI), there is a slider. It allows you to see where your Flowfile spent most of its time, and it may show you which point it got routed to.
Replaying A Flowfile
You may wish to inspect the contents of your Flowfile at some point during the dataflow in order to check to see if things are being processed as planned. The “Contents” tab shows information about the Flowfile’s contents like its size and content repository. When you click download, you are looking at the Flowfile’s contents as it existed at that very moment. The “Replay” button is near the bottom left just above the Connection ID. When you replay, the Flowfile is directed towards whichever connection that fed the component that created the processing event.
Checking the NiFi Server Logs
Every NiFi server has its own set of bootstrapping logs and applications. The Apache NiFi system uses SLF4J in order to provide a reasonably robust and configurable logging framework. You are able to configure it to give you a lot of information. Each log contains detailed information about the many processes that are occurring on your server.
You will find your NiFi server logs in your NiFi folder. You will find them in “logs/directory” because they are put there by default. The folder is called $NiFi_HOME, or it may be called NiFi_HOME if you untarred/unzipped NiFi after you downloaded it.
Look for the “NiFi-app.log” application log if you want further details about processors. For site-to-site, It will also show you remote process groups. The app log shows several system processes, which includes “Write Ahead Log” functions.
If you look for “NiFi-bootstrap.log” bootstrap, you will see that it contains entries on if the NiFi server is dead, stopped, or if it has started. In this log, you will also find a complete command with classpath entries that are used to start the Apache NiFi service.
Take a look in $NiFi_HOME/conf for the logback.xml. You are able to edit this log without having to restart Apache NiFi. Make a change, give it 30 seconds, and your logging changes will come into effect. The log level isn’t a cluster-wide configuration, which means it may be configured per node.
Try this lesson using our Auto-Launching NiFi – Learn how here
Learn more about Apache NiFi by downloading the free ebook Apache NiFi for Dummies: https://www.calculatedsystems.com/nifi-for-dummies
